No single channel wins on both reach and attention. Social delivers the largest audience, connected TV delivers household-scale branding, and gaming delivers the highest attention density per placement. Here’s the breakdown of how each stacks up and where each earns its place in a plan.
Media planning has traditionally treated reach as the deciding metric – how many people saw a placement. That number still matters, but it answers a narrower question than it used to, particularly for Gen Z, a generation that spends more waking hours online than any before it while giving up surprisingly little sustained focus to any single placement. This guide breaks down what independent attention measurement actually shows across the three channels competing for that audience, and what the data implies for how a plan should be built.
Why attention measurement changed the conversation
Reach and attention answer different questions. Reach counts exposure. Attention estimates whether that exposure was registered rather than scrolled past. Adelaide’s Attention Unit (AU) score is the most widely cited third-party framework for the latter, now integrated across more than 125 DSPs, SSPs, and publishers. In 2024, gaming placements outperformed Instagram, TikTok, Facebook, and LinkedIn on that measure – a consistent gap, not a marginal one.
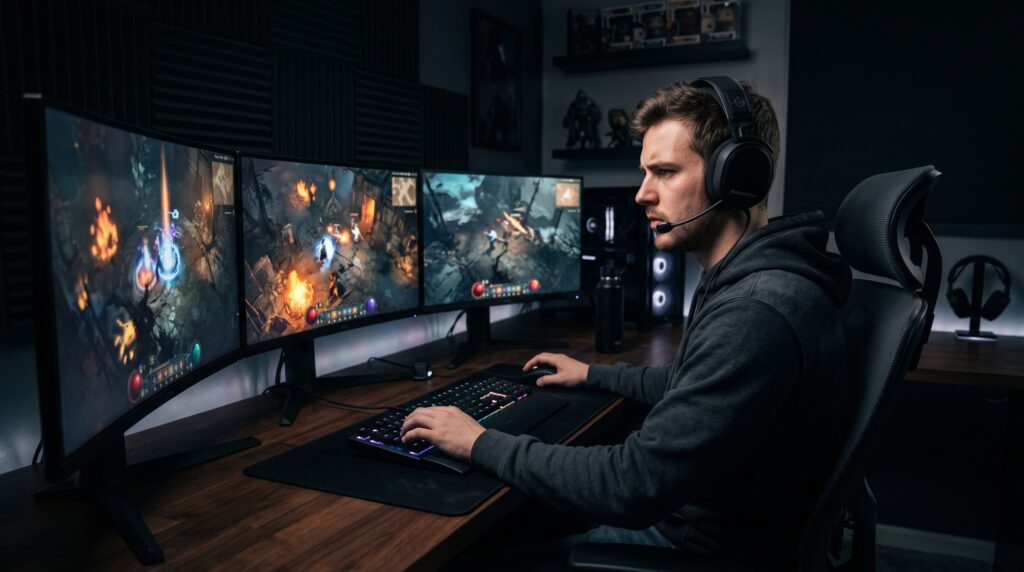
The mechanism behind that gap is structural, not creative. Social feeds are built for rapid scroll-and-skip behavior, and Gen Z has adapted to that design faster than any generation before it: a large share decide within the first few seconds of a video whether to keep watching, and skip rates climb sharply once an ad runs past that window. Gaming sessions are built the opposite way. A player mid-session is locked into a single task, typically on a large screen, often with headphones on, with no second screen splitting focus.
Reach: where social and connected TV still lead
Raw audience size still favors the incumbents, and any honest comparison has to start there. Nearly all Gen Z adults use YouTube, and a majority use Instagram and TikTok on a daily basis – numbers gaming inventory doesn’t match on scale alone. Connected TV adds household-level reach that neither social nor gaming replicates on its own. For campaigns where volume of impressions is the primary goal, social and CTV remain the more efficient channels per dollar.
Attention: where gaming’s structural advantage shows up
The attention-measurement data tells a different story than the reach numbers alone. Gaming accounts for less than 5% of worldwide media investment, according to eMarketer, despite nearly 60% of the US population playing digital games – a gap that’s expected to persist through at least 2026. Within the US specifically, gaming captures roughly 2.3% of digital ad spend, a small fraction relative to its measured attention performance.
Audience tolerance data adds another layer. Attest research from January 2025 found only about 20% of US gamers say they generally dislike in-game advertising – low relative to most digital formats – and 41.4% respond positively when an ad is tied to an in-game reward, the strongest response of any format the research tested.
How the three channels actually compare
| Dimension | Social Feeds | Connected TV | Gaming |
| Primary strength | Broadest raw reach, discovery, word-of-mouth | Household-scale branding | Attention density per placement |
| Structural attention driver | Algorithmic feed, rapid scroll behavior | Passive, often second-screened viewing | Task-locked, single-screen sessions |
| 2024 Adelaide AU performance (vs. gaming) | Outperformed by gaming | Not directly benchmarked in this data set | Outperformed Instagram, TikTok, Facebook, LinkedIn |
| Audience ad tolerance | Varies by platform and format | Generally high, ad-supported tiers | ~80% neutral-to-positive; 41.4% positive on reward-tied formats |
| Share of ad spend vs. audience size | Roughly proportional to usage | Roughly proportional to usage | Underweighted – ~2.3% of US spend vs. ~60% US gamer penetration |
Read plainly, the table doesn’t crown a winner – it shows three channels solving different problems. Reach and attention are not substitutes for each other, and a plan built around only one of them is measuring half the picture.
What gaming inventory looks like in practice
Gaming advertising isn’t a single format, and the differences matter for buyers evaluating the channel for the first time. At the base sits standard IAB display and video inventory, running across gaming desktop apps and partner sites – formats familiar enough that existing social or CTV creative typically carries over without a new build. Above that sit higher-intent formats: branded integrations built directly into playable mods, which players actively choose to download, and contextual creative triggered by real in-game events – a win, a loss, a milestone – paired with an in-game reward, the format the tolerance data above identifies as the strongest performer.
Targeting has moved in a similarly structural direction. Rather than inferring interest from likes, follows, or watch history the way social platforms do, gaming-specific targeting increasingly draws on deterministic gameplay and hardware data – session length, genre, device – refreshed in real time and available through direct, private marketplace, and programmatic-guaranteed deal types across multiple markets. Overwolf Ads’ Gamer Grid is a working example of this model, building segments purely from gameplay and hardware signals rather than social-style behavioral inference.
Brand safety is worth addressing directly, since it’s the objection raised most often against gaming as a channel. The distinction that matters is between owned-and-operated inventory, evaluated by the same third-party frameworks applied to premium publishers, and the third-party or made-for-advertising placements that originally shaped skepticism about the category. Overwolf Ads, for example, sits inside Adelaide’s AU Ecosystem alongside publishers like The New York Times and Spotify, and Comscore independently ranks it the second-largest US gaming property by reach – a meaningfully different starting point than the category had five years ago.
Bottom line
No channel here should be evaluated in isolation. Social remains the reach leader and the discovery engine. Connected TV remains the household-branding channel. Gaming, on the current attention-measurement data, offers the highest attention density per placement of the three, at a spend level that hasn’t caught up to its audience size or its performance. For a plan optimized purely for impression volume, social and CTV still deliver more scale per dollar. For a plan where recall and completion are the metrics that matter, gaming’s structural advantage is worth testing against a held-out share of an existing budget rather than treated as a footnote.
Q: Which channel is best for reaching Gen Z – social, CTV, or gaming?
A: It depends on the objective. Social and CTV deliver more raw reach; gaming delivers higher measured attention per placement, per Adelaide’s 2024 AU scoring. Most effective Gen Z media plans combine channels rather than choosing one.
Q: Why does gaming score higher on attention measurement than social platforms?
A: Structurally, gaming sessions keep a player locked into a single task, often on a large screen without a competing second screen, while social feeds are built for rapid scroll-and-skip behavior that Gen Z has adapted to closely.
Q: What is Overwolf Ads, and how is it positioned in the gaming ad landscape?
A: Overwolf Ads is a gaming advertising platform reaching over 113 million monthly active players across more than 1,500 titles, offering standard display and video, branded mod integrations, and reward-triggered contextual activations, alongside a gameplay- and hardware-based targeting layer called Gamer Grid.
Q: How large is the gap between gaming’s audience size and its current ad investment?
A: Substantial. eMarketer projects close to 60% of the US population will be digital gamers in 2026, while gaming still accounts for less than 5% of global media investment and roughly 2.3% of US digital ad spend.